

"One Good Trade" by Suri Duddella - May 16, 2023
A Difficult Day to Trade "ABC" pattern.

A Difficult Day to Trade "ABC" pattern
The ABC pattern strategy is the most simple yet powerful and effective chart pattern to trade. It can be used in various time frames and with different market instruments, suitable for day traders and swing traders. Different chart types, like time-based and alternate charts, can be utilized for identifying ABC patterns. The strategy involves a trend continuation (AB leg) followed by a counter-trend swing (BC leg). Accurate trend identification, identifying pivot points, and proper entry, stop, and target placement based on the ABC structure are crucial for recognizing an ABC pattern. While automation is not necessary, following precise rules and executing trades correctly is recommended.
I intend to review a difficult bullish ABC pattern formed on the @ES 5m chart, using the eSIX and TrailStops indicators, and describing their trading and exit strategy, even if the trade didn't go as expected.
Trade Setup
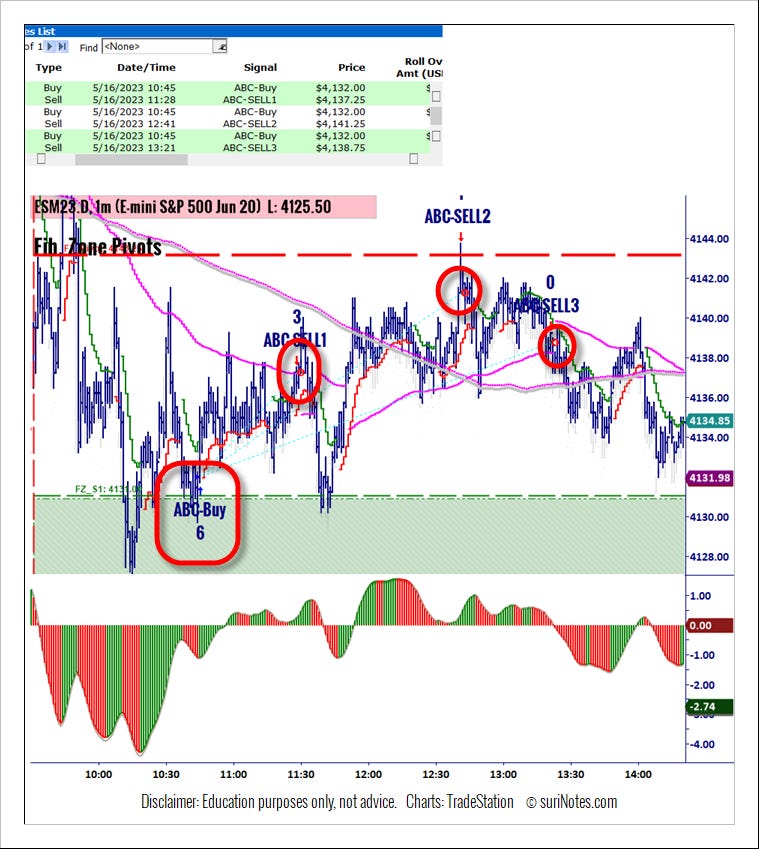
Today the S&P Emini futures (@ES) began to decline in the first hour, indicating a potentially significant down day. However, prices reached the support region of Fib Zones (4121-4131) within the first hour. At 10.15 am, prices crossed the 4130 level and found support to start moving upward. The eSIX indicator turned bullish with green SuperBars, suggesting a possible AB swing. A further observation was needed to confirm if an "ABC" pattern would form. In the next 30 minutes, the price retraced (BC leg) to the 4129 level, about 81% of the AB leg. A confirmed move above the "EL" level was necessary to validate the ABC pattern, supported by eSIX and TrailStop/SuperBars indicators. This particular ABC pattern had a smaller stop level at 4129.5 and target levels at 4138, 4141-4145, and higher.
ST = Short-Term TrailStops.
EL = ABC Entry Level
LT = Long Term TrailStop

How was it traded
A medium-sized long position (6 contracts) was initiated above the "EL" level of the ABC pattern at 4132, with a stop loss set at 4129. The first target for this position was set at the 4138–4141 level, the second target at 4147-51, and the third target was intended to be a runner with a trailing stop. The @ES market exhibited an unpredictable trend throughout the day as it slowly moved towards its first target level of 4137.25 (+5). At this point, the CMI and TICK charts indicated a potential sell-off, leading to the decision to exit half of the position. As expected, the @ES had a significant retracement but did not reach the stop-loss level. On the second attempt, the @ES reached the end of Fib. Zones/ABC first zone level 4141.25 (+9) after rebounding from the "EL" level. Two contracts were exited, and the remaining contract is currently being managed for higher objectives protecting with a trailing stop. Around 1.21 pm, the @ES market declined to trade below the "LT" level (also indicated by a red eSIX). As a result, the ABC trade exited the final contract at 4138.75 (+6).
LT = Long-Term TrailStop


Trade Results/Stats
Maximum Potential Profit (6 contracts): 12-15 points/contract
Maximum Potential Loss (6 contracts): 3-5 points/contract
Realized Profit: 6.83 Points/contract
Execution Efficiency: 0.45
Trade Setup Confidence: 65-75%
Tools Used
Auto ABC Pattern with Stops/Entry/Targets
Fib. Zone Pivots
Fib. Bands
eSIX
Combined Market Internals
SuperBars