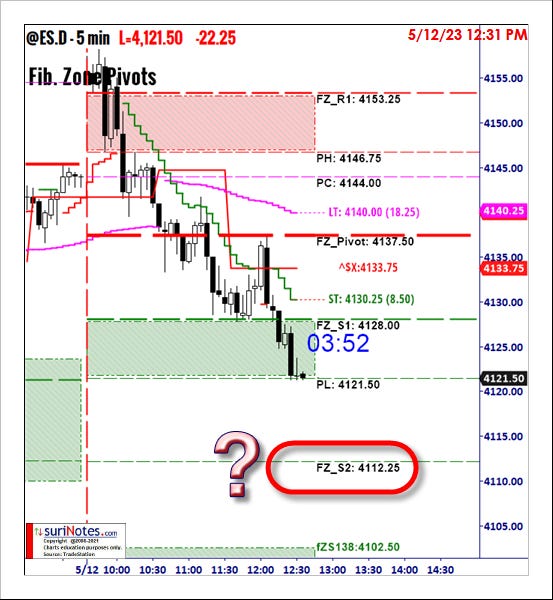
Amazing Fib. Zones and "R2 and S2 Sweeps"
Pivots are widely used in technical analysis to identify potential support and resistance levels in financial markets. A pivot is a simple calculation that uses the previous period's high, low, and closing prices to determine potential support and resistance levels for the current trading period. Market participants tend to remember critical price levels, and these levels can act as support and resistance in the future. Fib. Zones are computed using these Pivot price, Range from yesterday, and the Fib. Ratios. This Fib. Zones and their levels form potential support and resistance levels, so they may be more likely to reflect current market sentiment than more distant price levels. I discuss trades that occurred today using the S2 level (I call "S2 Sweep") in @ES intraday charts.
Trade Setup
One of the high-probability setups I found was to wait for "S2 sweeps" on sell-off days. Today market sold off most of the day and tested "FZP S2" level 5 times. When S2 levels are tested multiple times and reverse from this level (the opposite is R2 levels), prices usually indicate a greater probability of reversal trades. I use eSIX/SuperBar trend indicator to confirm the trend emergence before any trade. Price closed above @ES (5m) ST Level with eSIX showing positive divergence confirming the potential long trade. The initial stop level was obvious (below the S2 level). The idea for this trade is to let it run using Trailstops until the end-of-day while taking profits near the LT level at least half the size or exit the trade on ST cross down. (ST = Short-Term Trailstop, LT = Long-Term Trail Stop)
)
How was it traded
Today's "ONE GOOD Trade" was triggered after the S2 Sweep completion. The price tested the S2 level 5 times and showed positive divergence in eSIX. The trade setup is to enter a long trade with a medium size position (6 contracts) after the price closes above the "ST" level. After the initial surge, it will be protected using TrailStops. At 3 pm, a long trade was entered at 4119.5, with an initial stop below S2 (4112.5 level). Around 3.30 pm, prices reached the LT level to exit half the size (3 contracts) at 4129.5 (+10). The rest of the position was set to run until the market close. Price went as high as 4138, but trade was exited at 4133. (+14) on market close. This trade had a good run without any drawdown or retest of the "ST" level, hence it qualifies as "ONE GOOD TRADE" for today.
Trade Results/Stats
Maximum Potential Profit (6 contracts): 10-20 points/contract
Maximum Potential Loss (6 contracts): 7 points/contract
Realized Profit: 12 Points/contract
Execution Efficiency: 0.6
Trade Setup Confidence: 50-60%
Tools Used
Fib. Zone Pivots
TrailStops
eSIX
Super Bars
MAs


