Rectangle Channels & Opening Range Trading
Rectangle Channels
Rectangle Channel trading is a popular trading strategy analysts use to identify and exploit price channels in financial markets. The strategy involves identifying a price channel's upper and lower boundaries and then using those boundaries to determine potential buy and sell signals.
There are a few types of Rectangle Channels possible. 1. Trade the Support in an established channel. 2. Trade Rectangle Channel Breakouts.
Opening Range
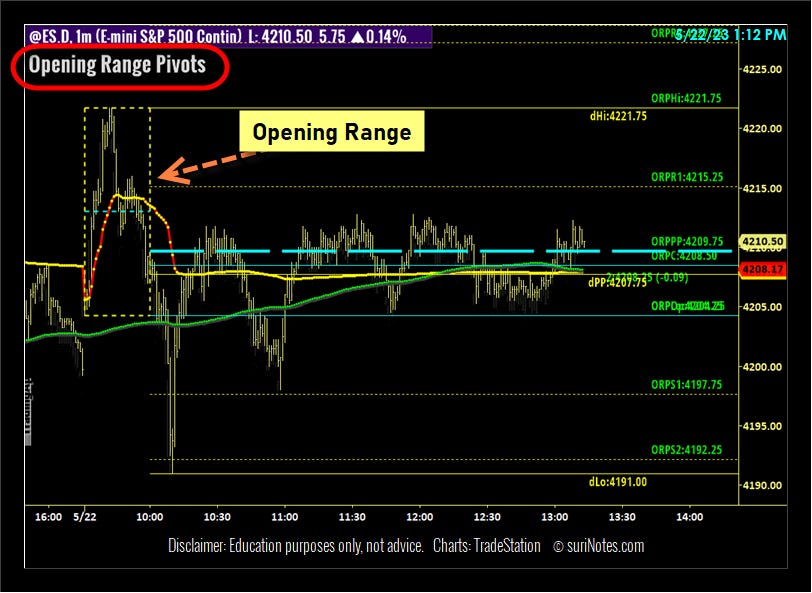
The Opening Range is typically defined by the high and low prices reached within a specified time frame after the market opens. The duration of the Opening Range can vary based on personal preference or the market being traded. It is commonly set at the first 30 or 60 minutes of opening trading.
Traders often monitor the price action during the Opening Range to identify key support and resistance levels and determine potential trading opportunities. Breakouts above or below the Opening Range can signal a shift in market sentiment and may be used as a basis for initiating trades.
Today, @ES traded in a constrained range that formed a rectangular channel. The Rectangle channel's range was also within range of a 30-minute opening stretch. The range of this rectangle channel was between Globex Pivot and Opening Range Low levels. Trading in narrow ranges makes the market trendless and challenging for most traders. Traders watch for emerging trends and breakout signals. I'll explain a trade opportunity I had using an opening range breakout and a rectangle channel range and how I executed the trade.
Trade Setup
Around 1:30 p.m., the @ES prices made five attempts to break out of the Globex Pivot levels while eSIX was in the green and above zero. The last two swing levels were higher highs and lower lows, which may indicate a potential breakout from the range in the following effort to trade higher. The rectangle channel range was around 8 points, and a breakout might expand the range by at least 8 to 12 points. One could set a stop loss from the entry (also below the 200 SMA, below the mid-range) at the lower half of its range.
How was it traded
Five contracts were used to enter a long position at 4210 as @ES showed breakout signals. Three points below its entry and below the 200 SMA and midpoint of the rectangle were established as the Stop level. 8–12 points (channel depth) are potential target levels. Target levels were established at 4218-4222 (near Day High), and the stop level was placed at 4207. TrailStops fully managed this trade, and any breach would be exiting the trade. Eighty minutes later, @ES attempted to attain DayHigh but soon began to reverse below the 'TrailStops' ST Level. The failure to break out from new Highs below trail stops typically indicates a reversal in the market. Three @ES contracts were sold at 4217 (+7 points) when the @ES traded below its trail stops, and the remaining contracts were sold at the following attempt to close below the trail stop level, 4215.25 (+5.25). By the close of the day, @ES declined further and traded as low as 4202.
Trade Results/Stats
Maximum Potential Profit (5 contracts): 12 points /contract
Maximum Potential Loss (5 contracts): 3-4 points/contract
Realized Profit: 8.1 Points/contract
Execution Efficiency: 0.675
Trade Setup Confidence: 50-60%
Tools Used
Opening Range Pivots
Globex Pivots
TrailStops
eSIX
Moving Averages


