

"One Good Trade" by Suri Duddella - May 11, '23
ABC Pattern with Market Context

ABC Pattern with Market Context
Most traders study market context to understand the state of the current market (oversold/overbought), direction, support/resistance levels, related key fundamentals, sentiment, and key inflection points. Trading in the right context can make a significant impact on successful trading. Each trader develops his own market context to trade. I trade Chart Patterns which are strongly supported by Market context. In this article, I'll explain the tools and concepts I use to understand market context while trading an ABC Bullish Pattern using Fib. Zone Levels and Fib. Bands (called Fib. Grid Structure).
The confluence of various price levels in the Fib. Grid structure along with emerging pattern structure (and pattern target/stop levels) helps me make a clear trade decision. Pattern trading is near precise (for me) as each pattern has specific rules to enter/stop and targets. When combined, Pattern analysis with market context gives a significant edge to trade. Patterns also fail but their failure levels are well-defined and that information is known prior to the trade. Hence, well-studied pattern trading has much more advantages than trading other methods (for me).
Trade Setup
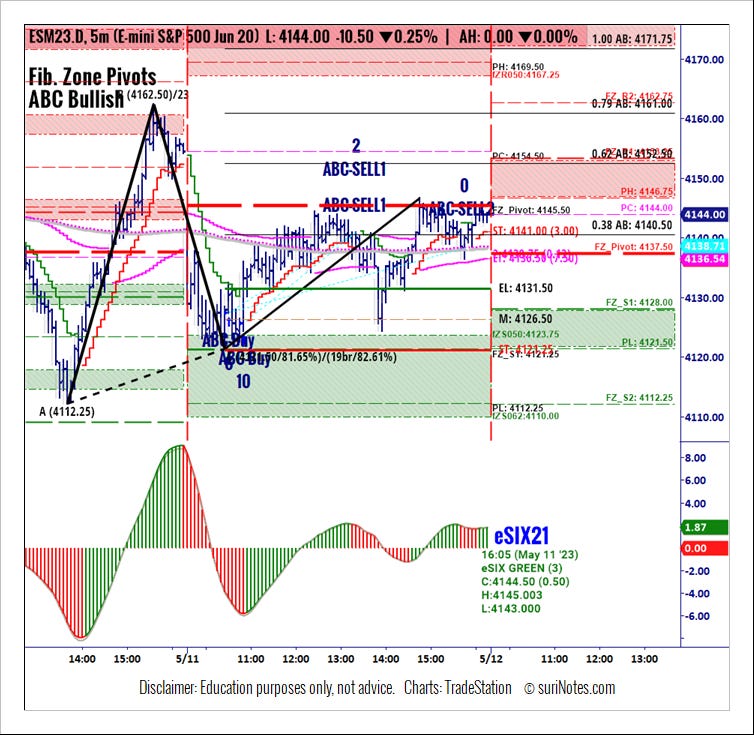
Today @ES sold off at the open and started to trade near the first Fib. Zone Pivots support zone. This retracement formed an ABC pattern in @ES 5-minute chart as the price reached 81% into the prior day's range. The 4121 was also the S1 level. Around 10.25 am, @ES started to show price stabilization and started. The eSIX (trend) was also signaling a potential ABC Bullish pattern as prices bounced off outside the Fib. Bands and key Fib. Zone Support zone (S1).


How it was traded
A high probability trade setup was formed as the confluence of market internals and ABC pattern. Entered a medium-size (6 contracts) long trade at 4127 as the price improved from the oversold (eSIX/SuperBars) and S1 levels. A 7-point Stop would have invalidated the ABC setup and failed the trade. ABC Targets were 4140 (38%AB) and 4152-4161 (62-78% AB). After 20 minutes or so, the pattern emerged strong as CMI and ticks showed more substantial potential to ABC breakout. Added another four contracts long at 4128.75) with 4121 stops. At 1.20 pm, @ES reached 38% AB level and started to show weakness, trading below the TrendST level (4142) and triggering a first exit at 4141 (+14). The prices quickly retraced to my entry price but continued to trade above the ABC stop level of 4121. Price bounced off ABC entry-level and quickly reversed its downtrend. Around 3.45 pm price reached the Daily Pivot level and started to retrace. This price action triggered to exit of the trade at 4138.5 (+11) before the markets close.
Trade Stats
Maximum Potential Profit (10 contracts): 20-25 points/contract
Maximum Potential Loss (10 contracts): 7 points/contract
Realized Profit: 11.5 Points/contract
Execution Efficiency: 0.47
Trade Setup Confidence: 70-80%
Tools Used
Auto ABC Pattern with Stops/Entry/Targets
Fib. Zone Pivots (Key Support/Resistance Levels)
Fib. Bands (Pattern Validation Tool)
eSIX (Trend Tool)
SuperBars (Trend Tool)
Combined Market Internals (External Market Info.)