

"One Good Trade" by Suri Duddella

Zone Analysis Trades using Fib. Zone Pivots
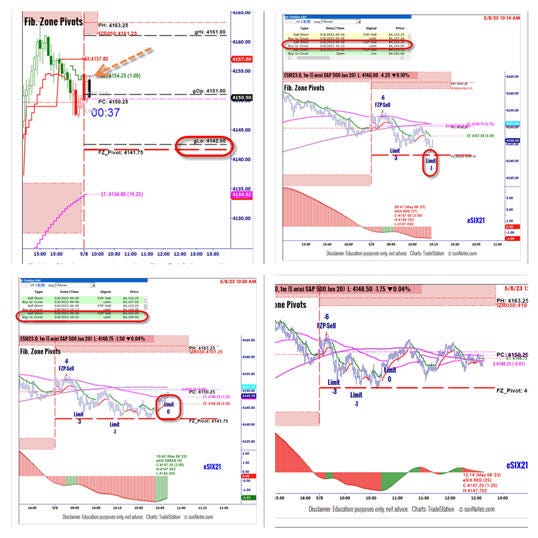
@ES Trade on May 08, 2023
The concept of price "Zone Analysis" was described in J.T. Jackson and Krausz's books. Short-term Zone Analysis uses previous day prices and builds a market support and resistance levels grid using the Fibonacci ratios and floor pivots for visuals. This grid of Support and Resistance zones aids traders in evaluating trading prices with some certainty. With statistical probabilities and price action, this unique zone analysis provides opportunistic trades to enter buy and sell orders strategically.
Trade Setup
This morning (May 08, '23) @ES opened slightly higher but placed well below the balance line, suggesting a potential test of the Pivot 4141. This allowed trade short from the Trend-ST level (4155) to the Fib. Zones pivot (4141) with a 3-point initial stop loss above the entry.

Trade
The trade was set to short six (6) contracts below 4155 on the break of ST. At 9.39 am, a short trade was entered from 4153.5. About 9 minutes later, it reached its first target of 6 points to 4147.25 (0.25 slippage). The second target of 9 points was reached before the Pivot Level (4141.75). The last contract was set to run towards the 4135 range (on 5m), but @ES quickly reversed its trade and headed back toward the entry. My TrailStop algo. was used to exit this trade once it crossed LT with a confirmed eSIX green trend. The final third exit was triggered (at 10.51a) for 4 points (4149). The net was 40 points before commissions. The trade was never in a losing mode and qualified for “One Good Trade” of the day.
Trade Result

Trade Stats
Maximum Potential Profit (6 contracts): 10 points/contract
Maximum Potential Loss (6 contracts): 3 points/contract
Average Realized Profit: 6.67 Points/contract
Execution Efficiency: 0.66
Trade Setup Confidence: 60-70%
Tools Used:
Fib. Zone Pivots & Globex Pivots
Intraday Balance Line
MAs
eSIX
VLTY
VWAP bands